Proper visualisation is the best way to make your content stand out, here are tips to do this effectively
When illustrating a review, a blog post, or any other content asset by visuals, you increase its view rate by 94 per cent and produce 180 per cent more engagement, which multiplies its chances to get shared and remembered. For even more boost, apply a non-standard approach to content creation.
Data visualisation goes far beyond pie charts, graphs, and diagrams today.
“Unique visualisation types had significantly higher memorability scores than simple graphs (circles, area, points, bars, and lines). It appears that novel and unexpected visualisations can be better remembered than the visualisations with limited variability that we are exposed to since elementary school.”
What makes visualisation memorable?
The only guidelines bloggers and business content writers should follow here are those about proper places for incorporating illustrations into the story. Top three locations are:
1. within a blog post, just after the first reference to a visual
2. at the end of a blog post section
3. at the end of a blog post, preceding the list of references (if you plan any)
Most common is when a visual element follows its initial citation or reference in the text. Also, a generally accepted criterion is to provide your every visual with a title and a caption (description), as well as its courtesy.
And when deciding what argument or fact to visualise, rely on these criteria:
1. Is it exciting? – Boring topics will rarely benefit from visual adaptation.
2. Is it complex? – Copybook maxims don’t need visualisation.
3. Does it spark a discussion? – If it’s unequivocal evidence, then it’s not worth the effort.
But when it’s not a fact of common knowledge, and you understand it’s worth visualising, the question arises as to what option and tool to choose for it. Here go top five for you to consider:
1. Spatial flesh
This option will come in handy when you do research and write on historical or political topics. Here you overlap two pictures so the audience could compare them by clicking and moving the slider.
Also Read: [Singapore]Data in the City: Visualisation Challenge
Also works for geographical projects: thus, Michael De Groot from Stanford University used spatial flesh for visualising his project on how European borders changed during World War II.
Entertaining blogs use this trick, either. As a rule, it’s about comparing “before” and “after” versions of something, to demonstrate changes over time.
2. Vox pops
From Latin “vox populi” aka “voice of the people,” this option will work best for any research or study involving public opinion. Interview respondents in the street, asking them short and clear questions about your topic, and then represent their answers in a business blog to your audience as a reflection of popular opinion.
Depending on your topic, choose between “what people think” and “expert’s opinion.” Think of open-ended questions but, at the same time, be specific enough to obtain brief answers. You are welcome to visualise solutions as a short video or a list of quotes with camera shots of your respondents.
3. Maps
Interactive maps in your content will captivate readers and encourage them to learn more. Perfect for illustrating location-related facts, they are more likeable and shareable as they save the audience from spending hours on reading tons of words.
Example:

See here how it works, as well as discover more options for your research visualisation: users click “play” and “draw” the map, learning the information behind the historical data at the same time. In today world of content shock and short attention span, structuring information this way can help you hook readers and save time on writing.
Also Read: Top 5 skills needed to carve a niche in big data
Moreover, such content will help you acquire links from many publications, which makes a positive impact on your blog rankings in Google.
4. Interactive charts
Research on years you’ve left to live can be a perfect illustration of this option. With tons of data in your pocket, you can engage readers even more b tailoring it to them personally: invite them to enter their details and get the result related to them specifically.

Interactive infographics are another option to try here. Those from BBC, The Guardian, Simply Business, and others speak volumes.
5. Timeline GIFs/videos
Perfect for illustrating your research on geographical and communities changes or predictions on cities, brands, and any other sector development. Timeline GIFs or videos are your instruments to use here, like in this latest animation from The Rankings on how the top 15 global brands have evolved over the last two decades
And last but not least:
Data visualisation is time- and energy-consuming. Cooperate with designers and developers, whether in-house and outsourced, but get ready to spend more resources than expected.
Yes, the game’s worth the candle; however, visualisation is like a cherry on top: worth nothing without a solid and delicious background.
–
Editor’s note: e27 publishes relevant guest contributions from the community. Share your honest opinions and expert knowledge by submitting your content here.
Join our e27 Telegram group here, or our e27 contributor Facebook page here.
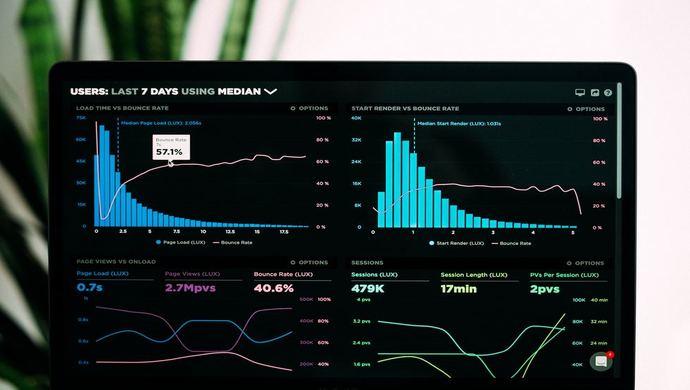
Image Credit: Luke Chesser
The post 5 extra ways to visualise your content for better conversion appeared first on e27.